高斯过程回归是一种基于贝叶斯的回归方法,有点难以捉摸,上一篇笔记从公式角度推了,这一篇从图的角度看看什么是高斯过程,如何进行高斯过程回归的,看到一篇国外博客说的很好,于是翻译了过来。参考见文尾。
协方差和高斯过程
高斯过程的核心就是用一个无线维度的高斯分布模型去拟合函数。也就是说目标函数的每个自变量都对应一组分布。首先从二维分布开始,如下,均值为零,方差都为1的二元高斯分布。
此处用两种图解方式,左边是两个变量的空间分布图,右图是高斯过程图,在这里解释一下:右图就是,两个变量的数值分别显示在x=0,和x=1,的位置并且连成一条线,每条线相当于一次采样,如果现在不太好理解,可以先存疑,后面会更容易理解。当协方差矩阵为$\Sigma
= \begin{bmatrix} 1 & 0 \ 0 & 1 \\
\end{bmatrix}$时,就是两个变量之间的独立的,此时采样结果可以看出来,两个变量之间时无关的,采样结果如图,左右都是随机分布:
1 | import matplotlib.pyplot as plt |

当$\Sigma= \begin{bmatrix} 1 & 0.98 \ 0.98 & 1 \\\end{bmatrix}$时候,相当于协方差矩阵做了变换,从线性变换的角度来看,是把两个基向量压缩至对角位置。此时,两个变量强相关,采样图如下,可以看到,产生的约束关系是$x_{1}= x_{2}$,右边的高斯过程图也表现出的也是两个变量保持几乎相等,在这注意,如果协方差矩阵某两个元素之间的协方差接近1,那么采样的时候就表现出两个点对应数值接近。1
2
3
4
5
6
7
8
9
10
11def m(x):
"""The mean function. As discussed, we can let the mean always be zero."""
return np.zeros_like(x)
p = figure(plot_width=800, plot_height=500)
D = 2
xs = np.linspace(0, 1, D)
for color in Category10[5]:
ys = np.random.multivariate_normal(m(xs), np.array(((1,0.98), (0.98,1))))
p.circle(xs, ys, size=2, color=color)
p.line(xs, ys, line_width=2, color=color)
show(p)

当$\Sigma = \begin{bmatrix} 1 & - 1 \ - 1 & 1 \\
\end{bmatrix}$时,相当于协方差矩阵做了变换: 线性被压缩至反对角位置。产生的约束关系是$x_{1} = {- x}_{2}$,此时采样图如下,可见高斯过程图每条线的左右两端和为1。这里只是为了理解,事实上此时的协方差矩阵不是正定矩阵.1
2
3
4
5
6
7
8p = figure(plot_width=800, plot_height=500)
D = 2
xs = np.linspace(0, 1, D)
for color in Category10[5]:
ys = np.random.multivariate_normal(m(xs), np.array(((1,-1), (-1,1))))
p.circle(xs, ys, size=2, color=color)
p.line(xs, ys, line_width=2, color=color)
show(p)

OK,我们继续高维模式,我们构造一个20维高斯分布,采样5次,先假设协方差为对角矩阵,即20个元素相互独立,高斯过程如图,点的个数即为多元高斯过程的维度,每个横坐标都对应的是一个分布。可以看出,现在多组分布之间是无关的。1
2
3
4
5
6
7
8p = figure(plot_width=800, plot_height=500)
D = 20
xs = np.linspace(0, 1, D)
for color in Category10[5]:
ys = np.random.multivariate_normal(m(xs), np.eye(D))
p.circle(xs, ys, size=2, color=color)
p.line(xs, ys, line_width=2, color=color)
show(p)

多组分布之间的关系是协方差矩阵控制的。在协方差矩阵是$\begin{bmatrix} 1 & 0.98
\ 0.98 & 1 \\
\end{bmatrix}$时,我们可以发现对角两组分布的协方差越接近1,就越“同步”,也就是说,如果$x_{1}$和$x_{2}$的协方差接近1,那么当$x_{1}= a$时,$x_{1} \approx
a$。现在我们希望高斯过程曲线不这么凌乱,希望相邻的两个数据之间更加平滑,也就是相邻分布之间相关性更强,越远的点相关性更差。因此构造协方差为:
若10维高斯分布,协方差矩阵是:

此时的高斯过程采样如图,这个协方差矩阵对应的约束即为:随机平滑曲线。

维度100时:1
2
3
4
5
6
7
8
9
10
11
12
13
14
15
16def k(xs, ys, sigma=1, l=1):
"""Sqared Exponential kernel as above but designed to return the whole
covariance matrix - i.e. the pairwise covariance of the vectors xs & ys.
Also with two parameters which are discussed at the end."""
# Pairwise difference matrix.
dx = np.expand_dims(xs, 1) - np.expand_dims(ys, 0)
return (sigma ** 2) * np.exp(-((dx / l) ** 2) / 2)
p = figure(plot_width=800, plot_height=500)
D = 100
xs = np.linspace(0, 4, D)
for color in Category10[5]:
ys = np.random.multivariate_normal(m(xs), k(xs, xs))
p.circle(xs, ys, size=2, color=color)
p.line(xs, ys, line_width=2, color=color)
show(p)

图解高斯过程回归
给定目标拟合函数,一条五次曲线:
1 | # coefs[i] is the coefficient of x^i |

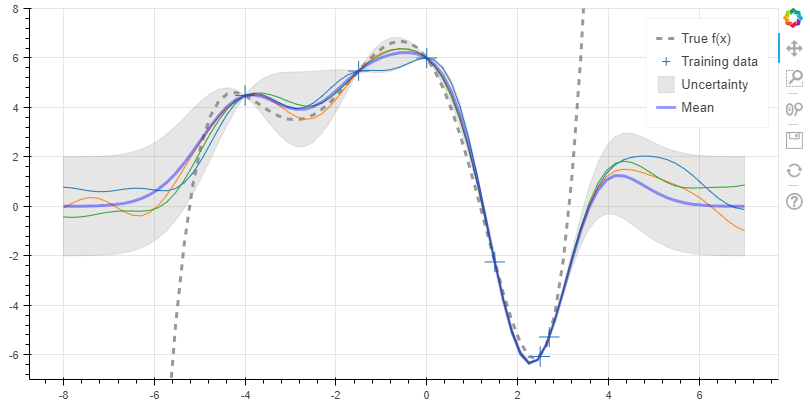
我们的目的是得到分布用无限个高斯分布来描述$\mathbf{p}\left( \mathbf{y}
\middle| \mathbf{x} \right)$:
其中均值$m\left( \mathbf{x} \right) = 0$,协方差矩阵为$K = \kappa\left( x,x
\right)$,这里的$p\left( \mathbf{y} \middle| \mathbf{x}
\right)$算是先验分布,因为我们还没用观测点呢。定义观测值为$(\mathbf{x,y)}$,对于测试点$x_{}$,我们希望预测$\mathbf{y}_{\mathbf{}}\mathbf{=
f}\left( \mathbf{x}_{\mathbf{*}} \right)$,那么观测点和测试点加一起的分布为:
其中$K = \kappa\left( x,x \right),K_{} = \kappa\left( x,x_{}
\right)\mathrm{\text{ and }}K_{*} = \kappa\left( x_{},x_{}
\right)$,我们暂且取均值为零。以上式子其实为条件分布$p\left( y,y_{} \middle|
x,x_{} \right)$,而我们只需要求解$\mathbf{y}_{}$,这里只给出结果:
首先用直接的放求解均值和方差:1
2
3
4
5
6
7
8
9
10
11
12x_obs = np.array([-4, -1.5, 0, 1.5, 2.5, 2.7])
y_obs = f(x_obs)
x_s = np.linspace(-8, 7, 80)
K = k(x_obs, x_obs)
K_s = k(x_obs, x_s)
K_ss = k(x_s, x_s)
K_sTKinv = np.matmul(K_s.T, np.linalg.pinv(K))
mu_s = m(x_s) + np.matmul(K_sTKinv, y_obs - m(x_obs))
Sigma_s = K_ss - np.matmul(K_sTKinv, K_s)
事实上,以上求解逆矩阵的方法不够优化,通常不会这么用。求解到方差之后,即可画出拟合模型,并且可以根据方差画出不确定度带。1
2
3
4
5
6
7
8
9
10
11
12
13
14
15
16
17
18
19
20p = figure(plot_width=800, plot_height=600, y_range=(-7, 8))
y_true = f(x_s)
p.line(x_s, y_true, line_width=3, color='black', alpha=0.4,
line_dash='dashed', legend='True f(x)')
p.cross(x_obs, y_obs, size=20, legend='Training data')
stds = np.sqrt(Sigma_s.diagonal())
err_xs = np.concatenate((x_s, np.flip(x_s, 0)))
err_ys = np.concatenate((mu_s + 2 * stds, np.flip(mu_s - 2 * stds, 0)))
p.patch(err_xs, err_ys, alpha=0.2, line_width=0, color='grey',
legend='Uncertainty')
for color in Category10[3]:
y_s = np.random.multivariate_normal(mu_s, Sigma_s)
p.line(x_s, y_s, line_width=1, color=color)
p.line(x_s, mu_s, line_width=3, color='blue', alpha=0.4, legend='Mean')
show(p)

协方差是如何影响高斯分布的
1 | import numpy as np |
